

12 Jun Instagram Analytics: what Metrics should you be tracking?
Instagram analytics are an excellent way to find out where exactly your Instagram account and marketing efforts stand.
Just like any other social media platform, you need to know how things are working for your brand on Instagram.
Instagram analytics provide you with an easy way to understand who your audience is, how they behave and interact with your brand, and how effective your posts are in capturing their attention and driving engagement.
Why is that important? Short answer: to get even better results in the future!
We know how important analytics and performance metrics are to your business, so, here’s how you can actually track them.
Business profiles on Instagram have access to the platform’s native analytics dashboard called ‘Insights’.
You can navigate to it by tapping on the graph icon – look for it on your Settings (iOS and Android have a slight difference):

Instagram Insights shows you tons of useful metrics you can use to understand how your brand is performing on Instagram (that’s why you have to learn about Instagram analytics).
However, what most businesses don’t know is that some metrics need to be calculated based on these viewable metrics, in order to gain a deeper insight into what is going on and where your Instagram account is heading.
Related: learn more about fake followers
But before we dive right into the calculated metrics, let’s look at all the different metrics you can access and view through Instagram analytics
Part 1: viewable metrics of Instagram Analytics
The Instagram Analytics dashboard is divided into three tabs:
- Activity
- Content
- Audience
Activity
The Activity tab shows you metrics that measure the overall reach of, and actions taken on, your Instagram profile and posts.
It is further divided into two categories:
Actions
The Actions metric measures the number of overall actions taken on your profile. It further includes sub-metrics that measure visits, clicks, or attempts to call you or access your location.
Profile Visits
This metric shows you the number of times your profile has been viewed.
Profile views are especially useful if you’re running a campaign, and want to see how well it’s doing in getting you followers.
Related: get more followers, the REAL ones, with this Instagram Automation Strategy
If you have an increasing number of profile views, but not as many followers, it might mean users who click on your profile aren’t finding your content attractive enough to follow you.
If you have fewer profile views overall, it probably means you’re either targeting the wrong audience, or just not producing content interesting enough to make users click.
Website Clicks
This metric shows you the number of times the website link in your bio has been tapped on.
Previously, Instagram did not allow anyone to add links to their profiles. Since that changed in March earlier this year, the platform’s analytics panel now lets you measure the clicks on those links too.
This is great news if you are making some changes to your Instagram marketing strategy that attempt to drive more traffic to your website. Website clicks show you if your strategy is working, or not.
Email and Call Clicks
This metric shows you the number of times users tapped on the email and call buttons on your profile.
A cool feature, exclusive to Instagram Business Profiles, is that you can add email and call buttons right below your bio to let users contact you easily.
This metric lets you find out how many of your viewers/followers have attempted to contact you.
Get Direction Clicks
This metric lets you find out how many of your users attempted to access the directions to your physical location.
If you’re a store, restaurant, gym, or any other business with a physically accessible location, you’ll want to show that on your profile.
Checking out this metric can be a good way to find out if your Instagram marketing efforts are motivating users to actually show up at your place.
Discovery
The Discovery metric measures the overall number of times your profile has been seen, or discovered. This is an organic metric, based on how many people interact with your content. If you’re creating great and consistent content, you’ll be able to reach more people just by keeping on doing what you do. This is one of the most important metrics in Instagram, and Instagram analytics.

-Reach
This metric shows the number of unique accounts that have seen any of your posts within the past week. This means if someone views your post multiple times, they will only be counted once. You can use this metric to find out how many unique users your post is actually reaching.
-Impressions
This metric measures the total number of times your posts have been seen in the past 7 days. Unlike Reach, Impressions includes multiple views by the same users too.

Content
Whatever you post on your Instagram account can mean the difference between the success and failure of your marketing efforts.
Whether it’s the colors you use in your photos, the way you write your captions, the hashtags you use, or simply the messages that you communicate, content matters.
The Content Instagram Analytics tab measures the effects of each and every picture, video, story, or ad that you post through your business profile.
You can use these metrics to find out what type of content gets you the best response and results, and where you could use some improvement. Instagram Analytics breaks down Content analytics into three different categories.
Post
This section lets you view all the metrics related to the pictures or videos that you have posted on your profile.
You can either view metrics for all your posts at once, or click on each individual post to see its own specific metrics.
Notice how Instagram Analytics also shows you how many follows are attributed to each individual post on your profile! This is an extremely helpful metric that shows you how effective your posts are. The engagement metrics include the number of likes, comments, and saves on your posts. These are also an excellent way of measuring the success of your posts in getting people to interact with your brand. The detailed Impressions of each individual post also contain metrics that tell you where users encounter your posts the most, such as from home, profile, hashtags, or other external sources.
You can also filter-out the metrics you want to see based on how old the posts are and the type of metric you want displayed.
Stories
The Stories section under the Content Analytics tab shows you metrics for all the stories you posted in the last 14 days. You cannot click on each individual story and view its metrics from here.
You can filter the data you want to see for all your stories based on the timeframe and actions, like forwards, backs, replies, exits, and swipes.
To view metrics of individual stories, open up your story and click on ‘Seen by’ located at the bottom of the screen. This will show you metrics like, who viewed your story, the number of impressions and reach, and what actions were taken.
Promotions
This section lets you access the metrics for any of your active or previous paid promotions.
You can click on a promotion to view its individual metrics for:
- Profile visits
- Number of people who viewed the promotion
- Impressions
- Engagements
- Audience demographics
- Amount of money spent
Promotion analytics help you find out if you’re getting a good return on the money you’re spending on each ad you run. You can use them to see how effective your paid campaigns are, and if you’re using the right content or targeting the right people.
Related: get more followers, the REAL ones, with this Instagram Automation Strategy

Audience
This tab shows you information about the audience of your Instagram marketing efforts. Here are some of the useful metrics you can find in here:
Followers
The number of followers you have is a quick way of finding out where you stand as a business on Instagram. More followers means more people are looking at your content. This automatically increases your chances of getting better results.
Related: create attractive content with these content tricks for your Instagram Feed
Demographics
You can view detailed data of who your followers really are. This section shows you graphical data on the age range, gender, and location of your followers.
This can be useful in finding out what kind of people like to engage with your brand. Do you have more males following you, or females? Do you need to target more people from Europe? Are your followers old enough to become your customers?
Hours and Days
This graphical metric shows you the time and day your followers are most (and least) active. You can use this data to post at optimal times in the future to get the best results.

Part 2: calculate metrics of Instagram Insights-Analytics
So, you have all the data in front of you. There is nothing else you could possibly need, right? … wrong.
The metrics you see on your dashboard don’t necessarily tell you everything you need to know about your brand. Some insights need to be calculated based on these viewable metrics, especially if you want to get a deeper and better understanding of how your brand is actually performing on Instagram.
Related: make the best Instagram Stories
These calculated metrics can be applied to multiple viewable metrics, and can let you analyze your account’s performance in the long run from a much broader perspective. Here are some important calculated metrics you should keep in mind:
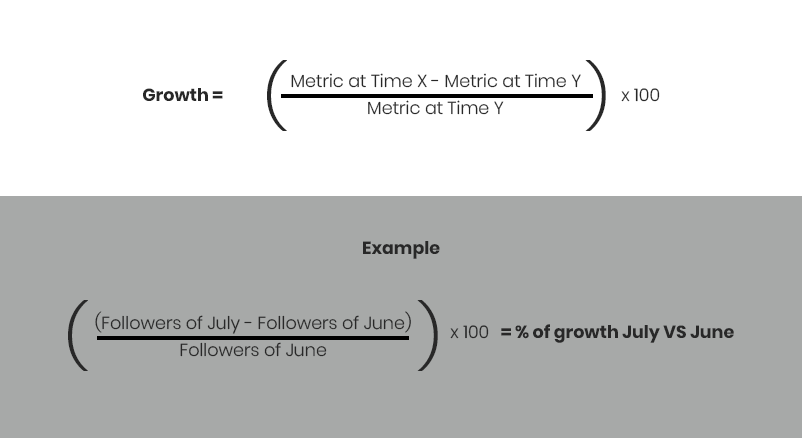
Growth
Calculating growth means figuring out the percentage of change (increase or decrease) in a metric between two different time periods. (You can calculate growth by using the formula below).
Some examples of growth that you can calculate are: follower growth, impression growth, engagement growth, website click growth, and profile visit growth.
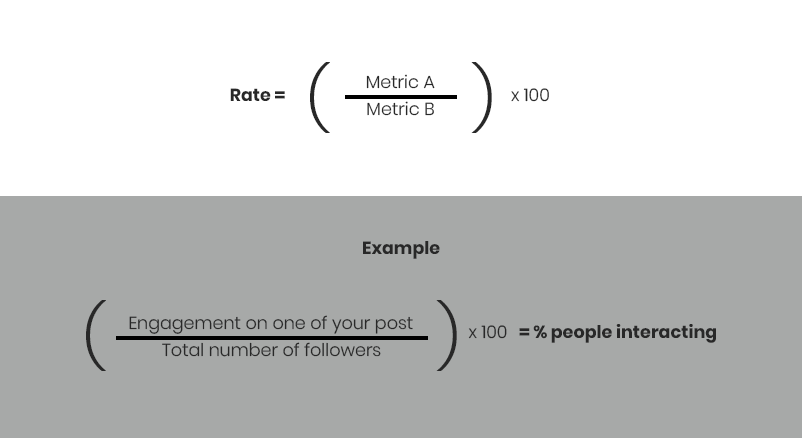
Rate
You can also calculate the rate, which is essentially a measure of one metric relative to another. (Below you’ll find how you can calculate the rate).
The example above gives you the percentage of your followers who engaged with a certain post. Calculating rate is effective when you want to know the relationship between two different metrics.
Other examples of rates you can calculate include: view rate, click rate, exit rate, and impression rate.
Average
Another important metric you can calculate based on the data available is the average count. (You can calculate the average by using the formula below).
Calculating the average gives you an approximate benchmark against which you can measure how well each of your posts is performing.

With an increasing number of businesses on Instagram competing for the attention of users throughout the world, analytics are becoming an essential part of a business’s social media strategy.
By analyzing the right Instagram metrics, you can find out how well your business is performing on the platform, and you can use this data to create even better posts in the future to maximize your results!
MegaFollow uses your Instagram account to automate likes, comments, follows and unfollows based on your needs so you can attract new, real and organic followers.
Be a better Instagrammer
Take a closer look to your Instagram analytics, and get the best of them!
Did you find any of these tips helpful? We’d love to know! Let us know your comments and feedback below.


No Comments